| Seismic Approach to Quality Management of HMA MnDOT Contract No. 1034287 Federal Project Number: TPF-5 (341) Execution: January, 2020 - December, 2021 |
| | | | | | | |
| PROJECT PROGRESS (October, 2020) |
Project Tasks | Summary (see details)
- Task 1: Project Management and Administration
Task 2: Hardware Development (Seismic Data Acquisition System) & Testing
Task 3: Software Development & Testing
Task 4: Delivery and Demonstration of Seismic Data Acquisition System and Software
Task 5: Final Report
Year 1 (2020):
Year 2 (2021):
Summary
- Quarterly (Q3) Report
The 3rd quarterly report has been prepared and submitted. It is posted here.
- TDMS Data Conversion Module Completed
- The module in ParkSEIS software that converts a TDMS file into the ParkSEIS (PS) format has been finalized into three (3) types. No
further development to accommodate other variation of the TDMS format will be attempted.
- Modules for Velocity (Vs) and Thickness (H) Evaluation - Algorithm Completed
- The modules in ParkSEIS that can evaluate the shear-wave velocity (Vs) and thickness (H) of an HMA layer automatically have been
completed in algorithmic development. They have been tested through both numerical modeling and actual field data sets in accuracy
and reliability. The modules will be further tested and improved once the 1D acquisition system being developed is available for more
extensive field measurements within the next few months (e.g., November - December). The algorithmic development is further
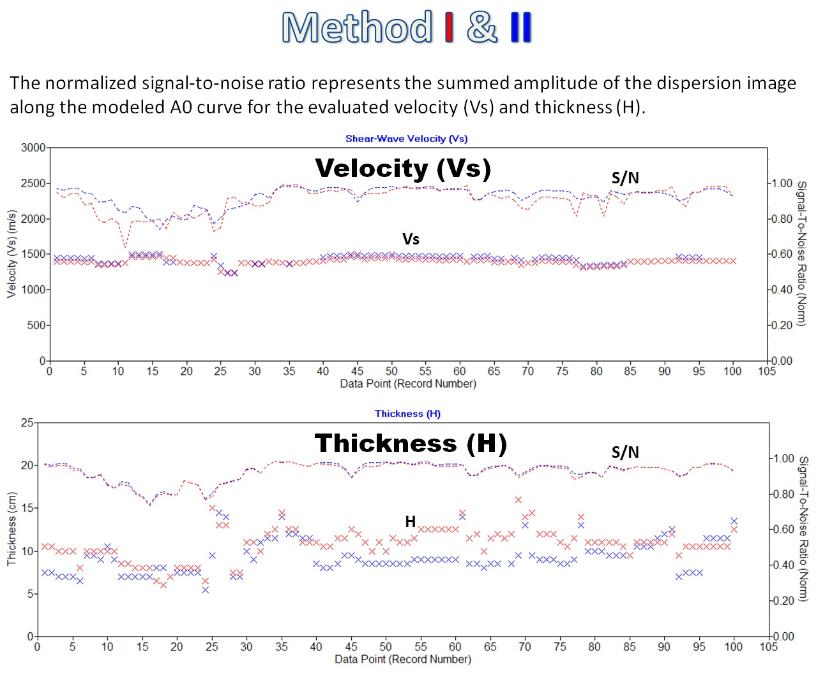
explained in this report. Two methods (Methods I & II) are developed as temporary options for the calibration and evaluation purposes
through further field tests. Results obtained from a set of field data (September 1, 2020) are displayed below. The data set includes
seismic measurements at 100 consecutive points along the road (approximately 100-m long distance) by using a field approach
presented here.
The values of velocities (Vs’s) from the two methods (I & II) fall within a reasonable range of HMA layer (e.g., 1300 m/s ≤ Vs ≤ 1500
m/s). The overall variation trend is quite smooth, indicating measured values from both methods are realistic. Velocities (Vs’s) from
both methods are similar approximately within 1.0% difference. The Vs’s from Method II are slightly higher than those from Method I
(approximately by 1%). The S/N values from Method II, however, are significantly higher approximately by 5%. In consequence, Vs’s
from Method II are believed to be more accurate. On the other hand, thicknesses (H’s) evaluated from the two methods are different
approximately by as much as 30% overall. In addition, the changing trends are fairly abrupt and irregular, indicating less realistic trends
than those of the velocity (Vs). In consequence, thickness values are much less reliable than the velocity values. The S/N values for H
evaluation from the two methods are almost (99%) identical. The H trend from method II, however, seems to be more consistent than
that from method I. In this sense, H results from method II are believed to be more reliable, which is consistent with the result from the
modeling data. For more details and further information, please see this report.
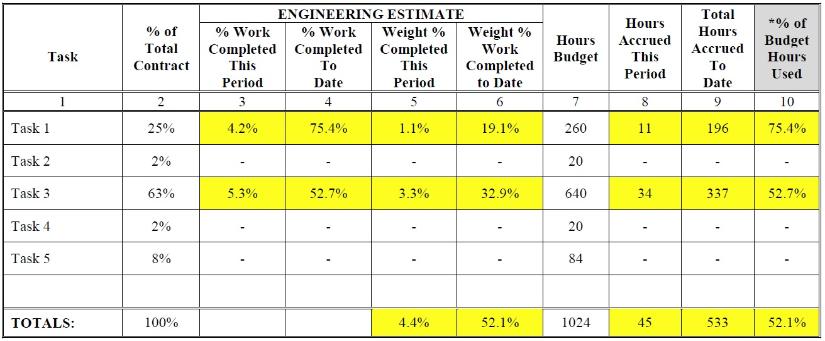
| Progress Table (Prime Contractor - Park Seismic LLC) - October, 2020 |
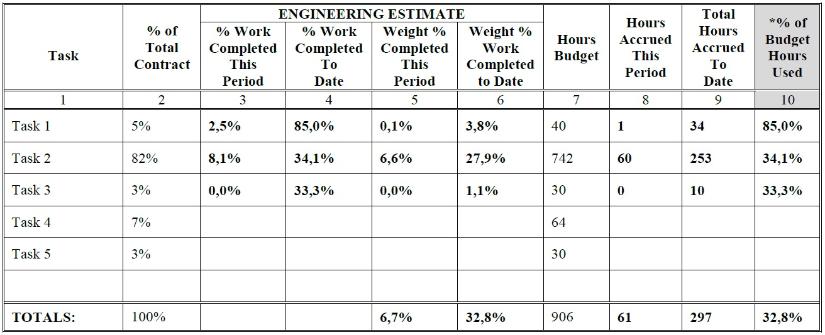
| Progress Table (Sub Contractor - Norrfee Tech) - October, 2020 |
Park Seismic LLC, Shelton, Connecticut, Tel: 347-860-1223, Fax: 203-513-2056, Email: contact@parkseismic.com