| Seismic Approach to Quality Management of HMA MnDOT Contract No. 1034287 Federal Project Number: TPF-5 (341) Execution: January, 2020 - December, 2021 |
| | | | | | | |
| PROJECT PROGRESS (June, 2020) |
Summary
- Acquisition System Being Constructed (16-bit max. 96-channel AD converter)
The system is under construction and scheduled for a field test in June-July by using the MEMS microphone receiver array used for
SYS-RYD-2019.
- Thickness (H) of HMA layer can be evaluated from the same Lamb-wave dispersion curve (A0) that is used to evaluate the shear-wave
velocity (Vs). On the other hand, it can also be evaluated from the spectral characteristics of obtained seismic data through the Impact
Echo (IE) method. Both approaches are examined during the month of June, 2020.
In theory, thickness of HMA layer (H) can be measured by the same Lamb dispersion curve, the fundamental anti-symmetric (A0) mode,
that is used to evaluate the shear-wave velocity (Vs) of the layer. An A0 curve consists of a curved part that has increasing phase
velocity with frequency and occurs at the low-frequency side of the curve (e.g., 1-10 kHz) and a relatively flat part with a fairly constant
phase velocity that occurs at the higher-frequency side of the curve (e.g., 10-50 kHz). The constant phase velocity of the curve
corresponds to the Rayleigh-wave velocity (VR) of the HMA layer, which is about 92% of the shear-velocity (Vs) for the common range
of Poisson’s ratio (e.g., 0.15-0.35). For a given HMA layer of VR, the onset frequency of the curved part from the flat part of the curve
changes with the thickness (H) of the layer; i.e., the thicker layer will result in the lower onset frequency. In consequence, the overall
shape of the curved part will also change with H. All these properties of A0 curve are graphically illustrated in this report.
Conventional seismic measurements through contact approach (e.g., accelerometer) well depicted both curved and flat parts of A0
curve. However, the non-contact rolling measurements by using MEMS microphones did not show clear definition of the curved part
although they delineated the flat part with superb quality. It is believed that this can be closely related to the spectral characteristics of
the light impact source that tends to generate more energy at higher frequencies (e.g., 10-50 kHz). This, however, will be verified soon
in the near-future when more microphone data sets are collected by using multiple impact sources of different impact energy. However,
the phenomenon may also be related to the near-field effect of surface waves as well as attenuation properties of the pavement layer.
In this report, these two aspects (i.e., near-field effect and attenuation property) are examined by using field data sets acquired in the
past by using both contact (i.e., accelerometer + hammer) and non-contact (i.e., microphones + bouncing ball) approaches.
- In parallel to the Lamb curve (A0) approach to evaluate the thickness (H), another independent approach that works on the spectral
characteristics of the measured seismic wavefields is now considered. It is the Impact Echo (IE) approach that measures the spectral
peak that is associated with the seismic resonance within the solid material. The peak occurs at the resonance frequency (fr) that is
determined by the P-wave velocity (Vp) and thickness (H or d) of the layer; i.e., = BVp / (2d) where B (=0.96) is called a correction
factor that slightly changes with Poisson’s ratio, but is commonly set to a constant value of 0.96.
First, two different approaches are tested to construct the amplitude spectrum; i.e., stacking individual amplitude spectrum from each
channel’s data [frequency-domain stacking (FDS)] and stacking all channels seismic data first and then construct the amplitude
spectrum [time-domain stacking (TDS)] (Ryden, 2016). It turned out TDS is far more effective than the former. Second, the most recent
development by Bjurstrom and Ryden (2016) that applies negative phase velocity to construct a frequency-phase velocity spectrum is
tested. This approach (Bjurstrom and Ryden, 2016) turned out highly effective and will be used as the main IE method in this project.
The future plan is to apply both approaches (A0 curve and IE) to evaluate the thickness (H). Then, both values will be used to come up
with an average value (Have) by applying an appropriate weight to each value based on a few quality factors.
In this report, the general scheme of the IE method is briefly explained. Then, a synthetic seismic record is generated to be used to test
each type of IE approach. Finally in this report, Bjurstrom and Ryden (2016) is used for real data sets from both contact and non-
contact approaches.
- TDMS Data Format
- A project to build a C++ module to read the TDMS file of seismic data saved by the acquisition system being developed at Norrfee Tech
is launched. The project will complete a separate C++ program that reads TDMS files and converts them into the ParkSEIS data format,
which is the standard format for the software package being developed.
Project Tasks | Summary (see details)
- Task 1: Project Management and Administration
Task 2: Hardware Development (Seismic Data Acquisition System) & Testing
Task 3: Software Development & Testing
Task 4: Delivery and Demonstration of Seismic Data Acquisition System and Software
Task 5: Final Report
Year 1 (2020):
Year 2 (2021):
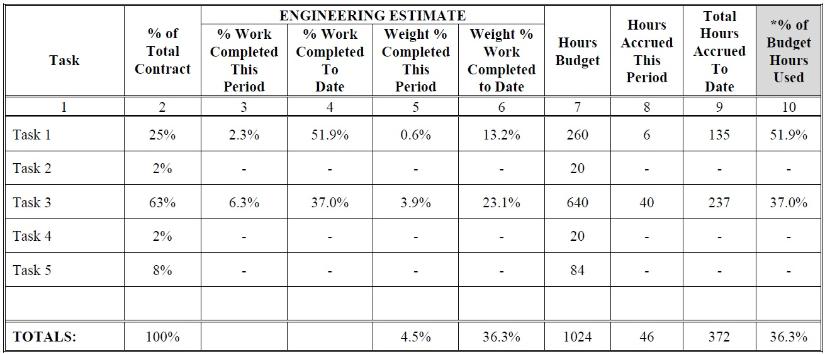
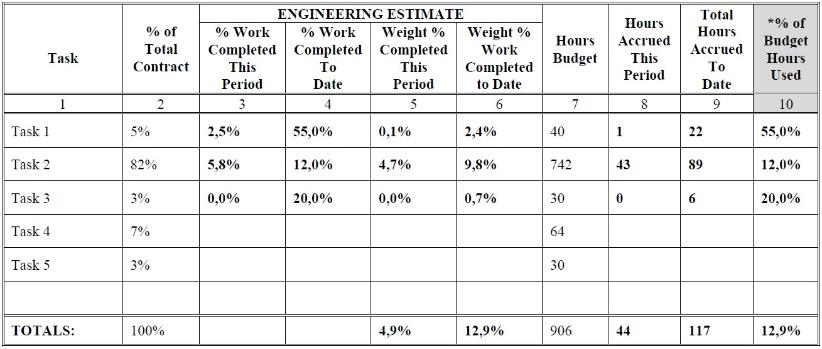
| Progress Table (Prime Contractor - Park Seismic LLC) - June, 2020 |