Project Tasks | Summary (see task details) (see project schedule)
Task 1: Project Management and Administration
Task 2: Hardware Development (Seismic Data Acquisition System) & Testing
Task 3: Software Development & Testing
Task 4: Delivery and Demonstration of Seismic Data Acquisition System and Software
Task 5: Final Report
Year 1 (2020)
Jan
Summary
The project officially started as of January 6, 2020. As each participant was revisiting the original project proposal, scope of work, description of tasks, and the project schedule, technical contents and the overall work flowchart were discussed for clarification of assigned tasks and interaction with other participants' tasks. General frameworks of the hardware and software were drafted. Blueprints for hardware system building and software package development were prepared. Early clarification of potential issues in the hardware, software, administrative, and budgetary aspects has been attempted. Communication methods among all participants were discussed. A dedicated web site (this HMA site) was planned to open soon for public access. A blog was also to be prepared soon as a means to post each participant's outcomes for mutual communication and calibration purposes. This blog will be open only among the project participants.
Technical and administrative contents of the project were prepared to present during the Kickoff and the 1st TAP (Technical Advisory Panel) meeting scheduled on January 23, 2020. Temperature calibration, which may be necessary during the dispersion analysis of Lamb waves, was briefly discussed as the topic was raised during the TAP meeting as a potential issue.
Project administration and management aspects (e.g., communication method, scheduling, monthly invoicing, reporting, and payment, etc.) have been heavily discussed and executed throughout the entire month.
Kickoff and Technical Advisory Panel (TAP) Meeting (January 23, 2020) (Minutes)
Monthly Project Meeting (January 28, 2020) (Minutes)
Progress Table (Prime Contractor - Park Seismic LLC) - January, 2020

Progress Table (Sub Contractor - Norrfee Tech) - January, 2020

Feb
Summary
A new data format convention was proposed by the software developer (Dr. Choon Park) to maximize the downloading speed and compatibility between the current hardware design base (that uses the LabVIEW TDMS format) and the software development base (that uses the ParkSEIS format). Considering the vast amount of data that, when completed, will be coming from the acquisition system for the pseudo-real-time onboard analysis, there should be a compact data format without unnecessary overhead information that will allow the software package focus directly on the analysis algorithm rather than spending extra time for data importing. Click for a brief demonstration of the new format on YouTube. A temporary data format, however, will be used as a communication tool to deliver data sets already collected by using a similar hardware system developed for other related projects at the Lund University until the hardware system for this project is fairly ready to be tested with the software package. The KGS format (a modified SEG-Y format) will be used
until then. A field data set collected by using the 48-channel MEMS microphones at the Lund University has been delivered to Park Seismic for the evaluation, by using the ParkSEIS MASW software package, of the optimum number of channels per longitudinal array (NCh-opt) and the optimum channel (receiver) spacing (dx-opt).
Modification of the ParkSEIS software, the base software package to be developed into the software packaged for this HMA project, has started. The first task is to upgrade its capacity to handle the highest frequency from 30 KHz to 100 KHz. This process is currently being applied to all related components in data import, display, FFT, and the 2D-wavefield transformation module to generate the dispersion image data sets.
Main hardware components have been specified and the first pricing quote has been received at the Norrfee Tech, AB. It seems the overall hardware budget (now re-estimated approximately as $35K) is higher than the one originally proposed (~$30K). It has been discussed to submit an amended budget proposal by shortening the overall project period so that the part of the labor cost can be reallocated into the hardware budget. This topic will be continuously discussed as the project proceeds.
Monthly Project Meeting (February 25, 2020) (Minutes)
Progress Table (Prime Contractor - Park Seismic LLC) - February, 2020

Progress Table (Sub Contractor - Norrfee Tech) - February, 2020

Mar
Summary
Hardware Parts Ordered
Parts to build multichannel acquisition system (MAS) have been ordered at National Instruments (NI). They are the main components needed to build a 64-channel acquisition system (expandable up to 96 channels). Other accessory parts (e.g., MEMS microphones) will be ordered soon.
Specifications of parts ordered (as listed on the quotation in English/Swedish)
Optimum Number of Channels Per Array (March, 2020)
The final system will consist of multiple linear (1D) MEMS microphone arrays arranged along the transverse direction side by side (see Figure 5 in the proposal). It is critically important to figure out the optimum configuration of the one (longitudinal) array in the channel spacing (dx-opt) and the number of channels allocated per array (NCh-opt). By using a field data set acquired with a 48-channel MEMS microphones with a very small channel spacing (i.e., dx=0.752 cm) (i.e., spatially over-sampled) over a special type of asphalt pavement in Sweden, a series of test have been executed through two types of spatial re-sampling approaches; i.e., the simple re-sampling of decimation and the stack-re-sampling approaches. The former simply reselects existing traces (channels) from the original full (48- channel) field record with a greater spacing (e.g., 2dx, 3dx, 4dx, etc.) by discarding in-between traces. On the other hand, the latter stacks (instead of discarding) them to make a new trace obtained with a greater spacing. This stack approach, called "receiver array", has been used for a long time in the seismic exploration for the purpose of attenuating the strong, but propagating at very low velocity, ground roll surface waves. These two re-sampling approaches are compared in the performance of enhancing the signal (Lamb) waves while attenuating the noise (air) waves at the same time.
According to the test results, it seems a 16-channel array with a 5dx (=3.76 cm), or a 4dx (=3.008 cm), channel spacing that connects (in parallel) all in-between MEMS microphones arranged with the current spacing of 0.752 cm. This means the stack-re-sampling approach turned out more effective than the other simple re-sampling (decimation) approach. With this configuration, the system will be able to handle HMA layers in a thickness (H) range of 4 cm (Hmin) - 20 cm (Hmax).
see SUMMARY of the procedures and results.
see APPENDICES for procedural details.
Monthly Project Meeting (March 31, 2020) (Minutes)
Progress Table (Prime Contractor - Park Seismic LLC) - March, 2020

Apr
Summary
Acquisition System Being Constructed (16-bit max. 96-channel AD converter)
Building the first (and the main) hardware component (AD converter) has started. It is the NI PXI System that can acquire a maximum of 96 channels with a 16-bit dynamic range. Description of the component items and corresponding specifications are listed here. It is "parallel prototyped" by referencing to the previous system developed for a similar project at Lund University (LTH) in 2019 ("SYS-RYD- 2019") (see photo below). The new system is more compact in size and lighter in weight. It consists of four (4) 24-channel ports allowing a maximum of 96-channel acquisition. However, only 64 channels will be used for this project. It will also include additional capacities of recording GPS coordinates and temperature of the HMA surface at the measurement points. The GPS receiver and infra-red (IR) temperature sensor are shown in a photo below.


Software Approach to Attenuate Impact-Generated Sound Wave
When using microphones as receiver to record the leaky-mode surface waves that are "leaked" from the HMA pavement surface, all ambient sound waves are also recorded as noise. The most troublesome sound wave is the one generated at the time of impact. It is always generated when an impact is applied on the pavement surface to generate seismic (surface) waves and it is very strong in
comparison to the level of signal seismic waves as shown in Figure 1 below. If not properly handled, it can cause a low signal-to-noise (SN) ratio at the high-frequency part of seismic signal (e.g., > 20 kHz) that can ultimately lead to a reduced accuracy in the evaluated frequencies (e.g., 1-10 kHz) that is critically important to accurately evaluate the thickness (H) of the pavement layer. Therefore, it is rucialcomparison to the level of signal seismic waves as shown in Figure 1 below. If not properly handled, it can cause a low signal-to-noise to reduce the level of this type of sound wave not only at the time of data acquisition but also during the data analysis steps.c This is especially important when dealing with an HMA pavement (rather than a concrete pavement) because of the more significant attenuation of seismic waves occurring with the HMA pavement as noticed in Figure 1b. A possible effort to reduce the level at the time of data acquisition has been outlined in one of the documents from previous month's progress.
Description of the test results obtained by using different software approaches is provided here.

Figure 1. (a) 48 channel MEMS microphone array and (b) acoustic data recorded while driving at 30 km/h. (From Ryden et al., 2019)


May
Summary
Acquisition System Being Constructed (16-bit max. 96-channel AD converter)
The system is under construction and scheduled for a field test in June-July by using the MEMS microphone receiver array used for SYS-RYD-2019.
Software Approach to Attenuate Air Waves (Continued Development)
Direct air (sound) waves generated at and coming from the impact point are the most troublesome noise for the microphone measurement of leaky-mode Lamb waves that have to be suppressed by means of both acquisition and post-acquisition efforts. In previous summary of the development, several different multichannel data-processing approaches were considered for their
effectiveness in attenuating the air waves (noise) while preserving the Lamb waves (signal) as mush as possible. They included fk-filtering, muting, and fk-muting approaches. They all turned out having pros and cons for the final goal of velocity (Vs) and thickness (H) evaluation of the HMA layer. This indicates all of them can be useful in different combinations under different condition of the
acquired data; e.g., data with a low SN ratio vs. a high SN ratio, etc.
The methodological development further continued to come up with a more effective approach based on the linear-move-out (LMO) approach. This report summarizes a new successful approach that uses a moving-window LMO stack to attenuate the air wave event of a specific propagation velocity (e.g., 334 m/s). Test results with synthetic and real field data sets indicate the effectiveness is superior over the previous conventional approaches (e.g., fk, mute, etc.), especially for the Impact Echo (IE) method that can evaluate the
thickness (H) independently from the analysis of propagating waves. This part of the result (IE) will be reported in next summary report.
TDMS Data Format
Although it seems to contain unnecessary components that can slow down data transmission speed between the hardware and the onboard software modules, the TDMS format will be condered for possible adoption after evaluating its structural format.

June
Summary
Acquisition System Being Constructed (16-bit max. 96-channel AD converter)
The system is under construction and scheduled for a field test in June-July by using the MEMS microphone receiver array used for SYS-RYD-2019.
Thickness (H) Evaluation [Lamb Dispersion (A0) and Impact Echo (IE) Approaches]
Thickness (H) of HMA layer can be evaluated from the same Lamb-wave dispersion curve (A0) that is used to evaluate the shear-wave velocity (Vs). On the other hand, it can also be evaluated from the spectral characteristics of obtained seismic data through the Impact Echo (IE) method. Both approaches are examined during the month of June, 2020.
In theory, thickness of HMA layer (H) can be measured by the same Lamb dispersion curve, the fundamental anti-symmetric (A0) mode, that is used to evaluate the shear-wave velocity (Vs) of the layer. An A0 curve consists of a curved part that has increasing phase velocity with frequency and occurs at the low-frequency side of the curve (e.g., 1-10 kHz) and a relatively flat part with a fairly constant phase velocity that occurs at the higher-frequency side of the curve (e.g., 10-50 kHz). The constant phase velocity of the curve corresponds to the Rayleigh-wave velocity (VR) of the HMA layer, which is about 92% of the shear-velocity (Vs) for the common range of Poisson’s ratio (e.g., 0.15-0.35). For a given HMA layer of VR, the onset frequency of the curved part from the flat part of the curve changes with the thickness (H) of the layer; i.e., the thicker layer will result in the lower onset frequency. In consequence, the overall
shape of the curved part will also change with H. All these properties of A0 curve are graphically illustrated in this report.
Conventional seismic measurements through contact approach (e.g., accelerometer) well depicted both curved and flat parts of A0 curve. However, the non-contact rolling measurements by using MEMS microphones did not show clear definition of the curved part although they delineated the flat part with superb quality. It is believed that this can be closely related to the spectral characteristics of the light impact source that tends to generate more energy at higher frequencies (e.g., 10-50 kHz). This, however, will be verified soon in the near-future when more microphone data sets are collected by using multiple impact sources of different impact energy. However, the phenomenon may also be related to the near-field effect of surface waves as well as attenuation properties of the pavement layer.
In this report, these two aspects (i.e., near-field effect and attenuation property) are examined by using field data sets acquired in the past by using both contact (i.e., accelerometer + hammer) and non-contact (i.e., microphones + bouncing ball) approaches.
In parallel to the Lamb curve (A0) approach to evaluate the thickness (H), another independent approach that works on the spectral characteristics of the measured seismic wavefields is now considered. It is the Impact Echo (IE) approach that measures the spectral peak that is associated with the seismic resonance within the solid material. The peak occurs at the resonance frequency (fr) that is determined by the P-wave velocity (Vp) and thickness (H or d) of the layer; i.e., = BVp / (2d) where B (=0.96) is called a correction factor that slightly changes with Poisson’s ratio, but is commonly set to a constant value of 0.96.
First, two different approaches are tested to construct the amplitude spectrum; i.e., stacking individual amplitude spectrum from each channel’s data [frequency-domain stacking (FDS)] and stacking all channels seismic data first and then construct the amplitude spectrum [time-domain stacking (TDS)] (Ryden, 2016). It turned out TDS is far more effective than the former. Second, the most recent development by Bjurstrom and Ryden (2016) that applies negative phase velocity to construct a frequency-phase velocity spectrum is tested. This approach (Bjurstrom and Ryden, 2016) turned out highly effective and will be used as the main IE method in this project.
The future plan is to apply both approaches (A0 curve and IE) to evaluate the thickness (H). Then, both values will be used to come up with an average value (Have) by applying an appropriate weight to each value based on a few quality factors.
In this report, the general scheme of the IE method is briefly explained. Then, a synthetic seismic record is generated to be used to test each type of IE approach. Finally in this report, Bjurstrom and Ryden (2016) is used for real data sets from both contact and non-contact approaches.
TDMS Data Format
A project to build a C++ module to read the TDMS file of seismic data saved by the acquisition system being developed at Norrfee Tech is launched. The project will complete a separate C++ program that reads TDMS files and converts them into the ParkSEIS data format, which is the standard format for the software package being developed.
Progress Table (Prime Contractor - Park Seismic LLC) - June, 2020

July
Summary
Field Data Sets from Newly Constructed Asphalt Road near Lund, Sweden (July 22, 2020)
Field data sets acquired on July 22, 2020, on a newly constructed asphalt pavement near Lund, Sweden, are processed and evaluated for various purposes. The data sets were collected by using the old system (“SYS-RYD-2019”). The overall data quality is evaluated as “excellent” from raw field records and corresponding dispersion images that clearly show well-developed Lamb wave arrivals and the fundamental-mode anti-symmetric Lamb dispersion (A0), respectively. Below are one of the several hundred records obtained (> 500) in the field (left) and corresponding dispersion image and other spectral characteristics (right). An approximate inversion results show velocity (Vs = 400 m/), thickness (H = 0.1 m), and Poisson’s ratio (POS = 0.3) (bottom). These are the results Norrfee Tech provided.
Further Testing of Air-Wave Alleviating Techniques
Testing of various multichannel techniques previously tested/developed that can alleviate adverse influence of air waves on the target analyses (i.e., Lamb and Impact Echo analyses) are tested for ten (10) randomly selected records from the data set on July 22, 2020. Three previously developed techniques are tested that can alleviate the air-wave energy as much as possible without compromising other useful attributes of obtained wavefields [e.g., wavefields for Lamb and Impact Echo (IE) analyses]. They are surgical mute (MUTE), fk-filter (FK), and air-wave subtraction by using moving-window LMO stack (AIR-SUBTRACTED). This report contains more details.
Quality Control (QC) Parameters
Testing of several quality control parameters for a particular type of wave (e.g., air or Lamb waves) such as overall amplitude (“Amp”), arrival time in ms [“msT0 (ms)”], velocity [e.g., “Vair (m/s)”], and peak frequency [“Fpeak (kHz)”] is performed by using the aforementioned ten (10) field record. This report contains more details.
TDMS Data Format
A project to build a C++ module to read the TDMS file of seismic data saved by the acquisition system being developed at Norrfee Tech was launched as of June, 2020. The project will complete a separate C++ program that reads TDMS files and converts them into the ParkSEIS data format, which is the standard format for the software package being developed. It seems necessary to use some library files provided by National Instrument (NI) for some functions to work properly within the C++ codes. This project is about to finish.
(One, #9, out of several hundread records collected)

Progress Table (Prime Contractor - Park Seismic LLC) - July, 2020

Progress Table (Sub Contractor - Norrfee Tech) - July, 2020

Aug
Muting Air and Pre-Lamb Wavefields
The importance of properly alleviating air wave energy existing in an acquired raw field record has been addressed multiple times in the previous work reports (e.g., April, May, and July progress reports). This report summarizes outcomes from one of those approaches when applied to a field data set acquired on August 12, 2020, on the same road previously surveyed (see here for previous survey results). Among multiple approaches, It is the “mute” approach summarized in this report that erases (i.e., zeros) all wavefields outside a designated mute window in a time-offset display of a raw field record. It turned out to be the most effective when constructing an accurate Lamb dispersion trend. It is also important to apply a pre-Lamb mute to reduce harmful influence from ambient noise. Therefore, both air-wave mute and pre-Lamb mute are simultaneously applied to the raw field record. Three (3) different types of mute have been tested. One is called “MANUAL Mute” that sets the mute window by visually inspecting the record to identify air-wave and Lamb-wave arrival times (msT0-air and msT0-Lamb) and propagating velocities (V-air and V-Lamb). With this approach, each record is manually muted one by one. The other type is called “SURGICAL Mute” that sets the mute window semi-automatically based on the presumptive values for msT0-air, msT0-Lamb, V-air, and V-Lamb. The arrival times (msT0-air and msT0-Lamb) can be approximately
estimated based on the acquisition parameter of pre-trigger time (e.g., 1.0 ms), which is the length of previous time after air waves triggered the recording and therefore should be included in the acquired record. The velocity values (V-air and V-Lamb) can be set arbitrarily based on a common range of each type of waves (e.g., V-air = 340 m/s and V-Lamb = 1500 m/s). Once these values are set, then the “SURGICAL Mute” applies the same mute window to all records existing in the input file automatically. The last type is called “AUTO Mute” that tries to detect all four parameters (i.e., msT0-air, msT0-Lamb, V-air and V-Lamb) automatically through its own detecting algorithm. The algorithm is based on the Linear-Move-Out (LMO) stacking to detect different waves (e.g., air vs. Lamb) arriving with different velocities. The “AUTO Mute” includes additional algorithms that can detect other wave attributes that may exist in the raw field record such as reverberating air wave arrivals, air wave arrivals from the opposite end of the receiver array, too-low signal-to-noise (SN) ratio, etc. They are automatically applied whenever detected being necessary to improve the accuracy in the evaluation of the mute window and also to improve the overall SN ratio of the recorded Lamb waves.
All three (3) approaches are applied to a data set acquired on August 12, 2020, on the same road previously surveyed on July 22, 2020. Results of time-domain records and corresponding dispersion images are displayed in this report for various comparison purposes in this report. Results from all three approaches are comparable to each other in seismic data and dispersion image qualities. However, the “AUTO Mute” provided slightly superior quality. The comparison will continue to be made on further future data sets to confirm the superiority. Advantage of pre-Lamb mute is illustrated in this report by using a field record that shows dispersion image trend at high frequencies (e.g., > 20 kHz) is improved due to the attenuation of ambient noise in the corresponding high
frequency range.
Importance of using a “proper” mute window is also illustrated in this report by using a field record.
Data Acquired on August 12, 2020
All (20) field records acquired on August 12, 2020, are displayed in this report in raw data format as well as processed dispersion image format for the purpose of evaluating Lamb wave quality. They were obtained by using both forward (FWRD) and reverse (REVS) impact sources attached at forward (i.e., #1 channel side) and reverse (i.e., #48 channel side) side of the receiver array, respectively (watch the video below). All reverse-shot records, however, are purposely flipped to look like forward-shot records by the software at the time
of data import, which is necessary to apply all mute approaches properly. In consequence, those reverse-shot records are separately marked by (*) to indicate so.
Comparing dispersion images from forward- and reverse-shot records, those from the reverse shots did not have proper Lamb dispersion trend as shown in this report. This seems to be related to a short pre-trigger time (0.5 ms) that was not long enough to catch the Lamb waves that arrived earlier than air waves by more than 0.5 ms (e.g., 1.0 ms) due to the extended distance between the array center and the impact point of the reverse shot. This will be verified from a next field survey with a longer pre-trigger time (e.g., 1.5 ms). This hypothesis was tested in two slides by using rough estimation of impact distances for both shots (i.e., FWARD and REVE) from the receiver array by using a configuration shown on a photo.
Amplitudes of forward and reverse shots are compared by displaying peak amplitudes of all (48) traces in each record in this report. The display indicates that, in general, the reverse shots were more powerful than the forward shots.
Decimation of channels (i.e., from 48 to 16 channels) was tested for each record from surveys performed during July and August for the purpose of evaluating any possible degrade of data quality in Lamb dispersion image. The results shown in this report indicate there is little difference, indicating that a 16-channel array will be able to provide an equally good quality.
TDMS Data Format
A separate project to make a C++ module to import a TDMS data file and convert into a ParkSEIS (PS) data file has been launched in mid July. The project was executed by a freelancer who used to work on building PXI systems (a similar hardware system for this project) that saved output data in TDMS format. The final code set has been delivered and is currently under modification to be merged into the ParkSEIS-HMA software package. It is not an entirely independent C++ code set, but has a dependency on the NI's built-in library that needs to be downloaded online and installed on the computer that runs the ParkSEIS-HMA package.
A 48-channel MEMS microphone array rolling with both forward (right) and reverse (left) bouncing impact sources.
Progress Table (Prime Contractor - Park Seismic LLC) - August, 2020

Progress Table (Sub Contractor - Norrfee Tech) - August, 2020

Sep
Summary
Project Updates at 2020 NRRA Pavement Workshop
Project updates have been presented as a 2020 NRRA workshop series on Thursday, September 3, 2020. The initial development, progress made so far, and the future direction of the project development have been presented during a 1-hour workshop. The overall summary of the project and the software development were presented by the principal investigator, Dr. Choon Park, while the hardware development was presented by co-investigators, Dr. Nils Ryden and Dr. Josefin Starkhammar. A total of 45-min presentations were followed by a 15-min Q&A session. NRRA posted the entire presentation at YouTube.
Automatic Muting (AUTO Mute) - Refinement Testing with Data Acquired on September 1, 2020
New field operations were conducted on September 1, 2020, at the same place used previously for data sets collected during July and August. Among many 48-channel records collected (about 500 of them), two TDMS files were obtained from the Team Sweden; i.e., “2020-09-01_19_12.TDMS” and “2020-09-01_19_24.TDMS” files that contained 100 and 50 field records, respectively. The same pre-trigger time of 0.5-ms was used. This 0.5-ms time, firstly used in August, turned out later (late August) too short to capture the earlier-arrival Lamb waves for the records obtained from the reverse shots (i.e., from the impact by the source attached on the back-side of the receiver array off the 48th channel) because of the longer distance between the impact point and the array. There was a total of 32 reverse-shot records for the “2020-09-y01_19_12.TDMS” data set that contained a total 100 records, while all 50 records were from the forward shots for the “2020-09-01_19_24.TDMS” data set.
First, the AUTO Mute algorithm previously developed and tested on a limited amount of field records (e.g., data sets from July and August) has been tested on these two data sets to evaluate the accuracy in the muting windows for air-wave and pre-Lamb waves. Results for all 150 records showed the AUTO Mute was highly effective when the raw records and the muted records were visually
compared side-by-side. These comparisons of seismic records are presented in this report. Second, data qualities are examined in dispersion images to valuate the effective recording of Lamb waves. While all reverse-shot records did not have any Lamb waves in the target frequency bands that are needed for the velocity (Vs) and thickness (H) evaluations (e.g., 10 kHz – 30 kHz), 54 forward-shot records (out of 68 such records) were in good quality that can allow a reliable Vs and H evaluations for the “2020-09-01_19_12.TDMS” data set. On the other hand, 39 records (out of 50) were in good quality for the “2020-09-01_19_24.TDMS” data set. These results put the “accept” rate of 80% and 78% for the two respective data sets.
Study of the optimum configuration for the 1D array has been one of the main goals of using the old (48-channel) system to collect field data under various different conditions (e.g., different section of the road, different temperatures, different source characteristics, etc.). Based on the test results from a limited amount of field data sets (e.g., the ones from July and August), it has been tentatively assumed that the 16-channel array with 3 times receiver spacing (i.e., 3dx) would be the most optimum configuration. With relatively vast amount of field records now available (i.e., 150), the test has been repeated to reinsure this 3-dx-16-channel assumption. This time, the AUTO Mute was applied to both full 48-channel records and the resampled 3dx-16-channel records to examine if there is any reduction in the effectiveness due to the reduced number of channels. The AUTO Mute results of 48-channel and 3dx-16-channel records are presented side-by-side in this report for visual comparison.
Then, dispersion images for the 3dx-16-channel records were obtained and compared side-by-side with those from the full (48) channel records by displaying them for the “2020-09-01_19_12.TDMS” data set in this report. No noticeable visual differences were observed from both the raw-seismic-data and the dispersion-image comparisons for the target frequency band (e.g., 10 kHz – 30 kHz). However, more systematic comparisons will be made in the near future by comparing key analysis results (e.g., Vs and H) from both data sets.
TDMS Data Format
The C++ codes written by a freelancer have been refined so that they can be incorporated into the ParkSEIS-HMA software module without any clash. It seems the codes were written in C codes (instead of C++) because the NI library components support only C codes. Some parts of the codes were restructured so that they contain only C components without foreign C++ components (e.g., classes). It seems that they are properly working, at least, with all TDMS files collected so far. The new round of testing will be executed
when the TDMS file of finalized structure is collected by using the new system for 1D array (sometime in November).
Progress Table (Prime Contractor - Park Seismic LLC) - September, 2020

Progress Table (Sub Contractor - Norrfee Tech) - September, 2020

Oct
Summary
Quarterly (Q3) Report
The 3rd quarterly report has been prepared and submitted. It is posted here.
TDMS Data Conversion Module Completed
The module in ParkSEIS software that converts a TDMS file into the ParkSEIS (PS) format has been finalized into three (3) types. No further development to accommodate other variation of the TDMS format will be attempted.
Modules for Velocity (Vs) and Thickness (H) Evaluation - Algorithm Completed
The modules in ParkSEIS that can evaluate the shear-wave velocity (Vs) and thickness (H) of an HMA layer automatically have been completed in algorithmic development. They have been tested through both numerical modeling and actual field data sets in accuracy and reliability. The modules will be further tested and improved once the 1D acquisition system being developed is available for more extensive field measurements within the next few months (e.g., November - December). The algorithmic development is further explained in this report. Two methods (Methods I & II) are developed as temporary options for the calibration and evaluation purposes through further field tests. Results obtained from a set of field data (September 1, 2020) are displayed below. The data set includes seismic measurements at 100 consecutive points along the road (approximately 100-m long distance) by using a field approach presented here.
The values of velocities (Vs’s) from the two methods (I & II) fall within a reasonable range of HMA layer (e.g., 1300 m/s ≤ Vs ≤ 1500 m/s). The overall variation trend is quite smooth, indicating measured values from both methods are realistic. Velocities (Vs’s) from both methods are similar approximately within 1.0% difference. The Vs’s from Method II are slightly higher than those from Method I (approximately by 1%). The S/N values from Method II, however, are significantly higher approximately by 5%. In consequence, Vs’s from Method II are believed to be more accurate. On the other hand, thicknesses (H’s) evaluated from the two methods are different approximately by as much as 30% overall. In addition, the changing trends are fairly abrupt and irregular, indicating less realistic trends than those of the velocity (Vs). In consequence, thickness values are much less reliable than the velocity values. The S/N values for H evaluation from the two methods are almost (99%) identical. The H trend from method II, however, seems to be more consistent than that from method I. In this sense, H results from method II are believed to be more reliable, which is consistent with the result from the modeling data. For more details and further information, please see this report.

Progress Table (Prime Contractor - Park Seismic LLC) - October, 2020

Progress Table (Sub Contractor - Norrfee Tech) - October, 2020

Nov
Summary
Field Laptop Computer
A rugged laptop computer has been procured and customized by installing the ParkSEIS-HMA (PS-HMA) software package to be used for field data acquisition and pseudo-real-time on-borad data processing purposes. It has an enhanced computing power, fast solid-state hard drive, embedded touch-screen capability, and sufficient RAM memory (16 GB) to meet the challenging demands. It has been used at Park Seismic to test the PS-HMA software developed to handle the 1D-array data and then shipped to Norrfee Tech for the 1st Joint Field Test (JFT) scheduled on December, 2020.
ParkSEIS-HMA (PS-HMA) Software Package for 1D-Array Data
The ParkSEIS software package for this project (ParkSEIS-HMA) has been developed to perform the in-field operation of raw seismic data collected by using a 16-channel MEMS-microphone-array acquisition system that has been developed at Norrfee Tech. The algorithmic development that can properly handle different types of wavefields had been finished by the end of last month (October 2020) as summarize in this previous report. Therefore, the Graphical User Interface (GUI) part of the software have been developed and tested during this month as summarized in this report.
Most components in the "IN-FIELD" module can perform the following tasks:
- Open a "New Project" for a new survey.
- Specify the folder where the raw TDMS data files are saved by the acquisition hardware system.
- Specify the folder where the TDMS data files (*.tdms) are converted and saved into ParkSEIS (PS) format (*.dat) for subsequent analysis by PS-HMA. All intermediate and final analysis results are also saved in this folder.
- Some recording-related parameters (e.g., sampling rate, number of samples, pre-trigger time, etc.) are set here and then passed into the acquisition-system control software installed at the PXI hardware system.
- Some parameters that can control the automatic detection and analysis of signal wavefields (e.g., surgical mute parameters, wavefield transformation parameters, etc.) can also be specified.
- Some parameters that can control visualization of the final results of the shear-wave velocity (Vs) and thickness (H) of the HMA layer can also be specified.
- Once "armed", it notifies the acquisition control software at PXI system to be ready for data collection.
- It detects new raw TDMS files being saved by the acquisition system, converts them into PS-format files, and then executes all planned data-analysis steps to finally display the results in a fully automated manner.
All above steps are illustrated by using the Graphical User Interfaces (GUI's) in this report.
Hardware Development (16-Channel 1D-Array System)
The development of a 16-channel data-acquisition system by using MEMS microphones is under progress. Some circuit boards had to be re-designed to use new MEMS microphones as the old components have been discontinued. The new circuit boards are currently being constructed and the beta version of the 1D acquisition system will be ready for the Joint Field Test (JFT) soon.
Progress Table (Prime Contractor - Park Seismic LLC) - November, 2020

Progress Table (Sub Contractor - Norrfee Tech) - November, 2020

Dec
Summary
ParkSEIS-HMA (PS-HMA) Software Package for 1D-Array Data (Update and Improvement)
The ParkSEIS software package for this project (ParkSEIS-HMA) has been developed to perform the in-field operation of raw seismic data collected by using a 16-channel MEMS-microphone-array acquisition system that has also been under development at Norrfee Tech. The Graphical User Interface (GUI) part of the software has been summarized in a previous report. The files describing communication between these GUI components and the hardware (PXI) system were previously sent to Norrfee Tech to optimally pass acquisition-related parameters to the PXI system as summarized in this file as well as in this appendix file. This communication part has been continuously modified and refined to meet various changes and updates made in the hardware (PXI) control software. The focus has been on the ability by the ParkSEIS software to notify the PXI system to "ARM" the system so that the acquisition-hardware system can collect data whenever the seismic source makes impact on the HMA surface. This effort has been summarized in this file. The first successful communication between the ParkSEIS and the PXI system had been made via a lab test on December 4, 2020.
Hardware Development (16-Channel 1D-Array System)
The development of a 16-channel data-acquisition system by using ("new") MEMS microphones has been under progress at Norrfee Tech. The beta version of the 1D acquisition system (see photo below) is ready for the Joint Field Test (JFT) soon. As soon as other peripheral components, such as cables, array-holding apparatus, impact-source device, etc., are ready, the JFT will be executed sometime in January, 2021.

Progress Table (Prime Contractor - Park Seismic LLC) - December, 2020

Progress Table (Sub Contractor - Norrfee Tech) - December, 2020

Year 2 (2021)
Jan
Summary
Field Test with New 16-Channel Array and DAQ at Gunpowder Mill (January 9, 2021)
Norrfee Tech tested the newly built 16-channel array in the field (see photo below). The array is now attached through more rigid metal bar (instead of wood bar) to the main frame of the bicycle rack. The array was wrapped with cloths to protect it from external wet conditions on the road. The impact source was attached to an independent bar separate from the receiver array to minimize the possible transmission of its impact vibration to the receiver array. It was tightened to the bar through a rubber cushion to further insulate its vibration from the holding bar. This time, the impact source ("bouncing ball") was attached to the bar through a strap shorter than previously used. This resulted in more frequent impacts. More details about the new array, its attachment on the bicycle rack, waveforms collected at two different speeds (slow 15 km/h and fast 30 km/h), voltage ranges of waveforms, 16-channel field records, and their corresponding dispersion images are presented in this report prepared by Norrfee Tech.
AUTO Evaluation of Data from Gunpowder Mill by Using ParkSEIS-HMA
The ParkSEIS-HMA used two of the field data sets obtained during the field campaign outlined above to test the automatic analysis mode of the software. One data set ("T210109_25.TDMS") contained ten (1) records of all correctly triggered acquisition. The other data set ("T210109_140.TDMS") contained one hundred (100) records of both false and valid triggers.
The results of shear-wave velocity (Vs) and thickness (H) profiles are presented in this report for different "lateral continuity (LC)" values that are directly related to the lateral averaging of the dispersion images. The report also presents evaluation results for different attributes such as DC bias, raw field records, automatic muting, and dispersion images for different LC values for all constituent records (10 and 100) of the two data files.

Progress Table (Prime Contractor - Park Seismic LLC) - January, 2021

Progress Table (Sub Contractor - Norrfee Tech) - January, 2021

Feb
Summary
The 1st Joint Field Test (JFT #1) with New 16-Channel System and ParkSEIS-HMA Software (February 23, 2021)
The 16-channel acquisition system built in January has been used for the first Joint Field Test (JFT) along with the ParkSEIS-HMA software package on February 23, 2021. The test lasted about 2 minutes driving the survey vehicle about 1 km distance. It collected 50 TDMS files that contained fifty (50) 16-channel records per file, totalling 2500 records (measurements). This corresponds to one measurement about every 0.4-m distance. The photo below shows the real-time running of the ParkSEIS-HMA software inside the vehicle during the field data acquisition.

Evaluation of Data From JFT #1 with ParkSEIS-HMA
The ParkSEIS-HMA software processed 200 records (out of 2500 total) during about 5-minute duration. It had be to stopped while it was processing more records because of the concern that the acquisition system (PXI unit) might be consuming too much power. Nonetheless, the program displayed results of the shear-wave velocity (Vs) (top) and thickness (bottom) of the HMA pavement as shown below for the number of records it processed before its termination.
Further evaluation of all acquired records and also the ParkSEIS-HMA software that encountered a few error messages during the test is currently under way.


Progress Table (Prime Contractor - Park Seismic LLC) - February, 2021

Progress Table (Sub Contractor - Norrfee Tech) - February, 2021

Mar
Summary
The 1st Joint Field Test (JFT #1) on February 23, 2021 - Results
Norrfee Tech performed the first joint field test (1st JFT) on February 23, 2021, on a road near Lund, Sweden. The purpose was to jointly test the hardware system of the 16-channel MEMS microphone array and the ParkSEIS-HMA software under a real survey condition. The survey vehicle moved at about 15 knot/hour (~17 MPH) speed for about 4 minutes to travel about 1.3 km distance. This collected fifty (50) TDMS files (T210223_1.TDMS – T210223_50.TDMS) of fifty (50) 16-channel records per TDMS file except for the last TDMS file of only one (1) record/TDMS. The 48th file (“T210223_48.TDMS”) was a faulty file with incorrect channel assignment, cause of which is under investigation. In consequence, a total of 2401 records were collected.
Number of records and survey distance outlined above indicate that, on average, one impact was delivered every 0.5-m distance. The ParkSEIS-HMA software was performing file transfer, conversion, and subsequent data analysis in pseudo-real-time mode inside the survey vehicle. However, the software had to be terminated prematurely after processing six (6) TDMS files. This was because the acquisition (PXI) system had to be powered down as it was consuming a significant power of the electric vehicle. The ParkSEIS-HMA, therefore, is currently under modification so that it can separate its file transfer & conversion from the analysis part of the software. This will enable the PXI system to be powered down as soon as the survey finishes and the ParkSEIS software can continue the analysis on the installed laptop computer.
After the field operation, the ParkSEIS-HMA processed all (50) TDMS files through a simulation of the JFT in the lab by feeding each TDMS file manually from a network drive (that represented the PXI system). The process results showed acquired Lamb waves have extremely high signal-to-noise (SN) ratio of about 93%; e.g., a SN of 100% means all Lamb waves and no noise, while 0% means all noise and no Lamb waves. This unusual quality seems to be the result of the high fidelity of the new acquisition system. It seems the low-temperature of the asphalt also contributed to the high quality because of the low attenuation of the seismic waves. There were eight (8) false-trigger (FT) records out of 2350 total production records, which puts the FT ratio under 0.4%. The results of shear-wave velocity (Vs) showed an average of about 1800 m/s, while those of the thickness (H) showed an average of about 10 cm. Both values seem highly reasonable. The temperature data showed an average of 6.5 degrees in Celsius.
This report has more details about the results and future plan for the 2D system.

1st Joint Field Test (JFT) near Lund, Sweden. Data points recorded every 1 sec are marked on the map.
(Top Right): ParkSEIS-HMA software showing the data quality of extremely high SN ratios.

Results of shear-wave velocity (Vs), thickness (H) of the surveyed asphalt road. Temperature of the road is also displayed.
Progress Table (Prime Contractor - Park Seismic LLC) - March, 2021

Apr
Summary
- The 1st Quarterly Report of 2021 Submitted
The first quarterly report in 2021 has been submitted to the TAP members on April 20. It is posted here. - ParkSEIS-HMA (PS-HMA) Display Module Updates
The ParkSEIS-HMA (PS-HMA) software package has been updated on the display module. Previously, it displayed the shear-wave velocity (Vs), thickness (H), and temperature (T) of the HMA pavement for the measured records in the order of record number. Each XY-chart therefore displayed the output values of Vs, H, and T in the Y axis with the record numbers in the X axis. This is because, previously, the GPS data were not used for coordinate information due to the unavailability of the GPS coordinate decoding module that converts latitude and longitude to local distance coordinates.The GPS data are now properly handled to generate UTM coordinates, which present data points in local X-Y coordinates. The GPS and temperature measurements are made every one second, while the seismic measurements are made whenever the bouncing ball makes the impact on the pavement. Although the spatial interval between successive impact points varies with the survey speed and surface condition of the pavement (as well as the source characteristics), the average interval is about 0.5 m at a common survey speed of 20 km/hr with current source. This means there are about 11 impacts made every second. Every seismic record has its own timestamp measured in milliseconds and so does every GPS point. Therefore, by comparing the timestamp, the measurement location of each record can be deduced from the GPS data points. Because GPS data pints are measured less often than the seismic data, the GPS data are interpolated based on the timestamp to assign GPS data to the intermediate records. This is the way each record gets its own location information. Because the temperature data are measured at the same time when GPS data are measured, each record gets its own temperature data in the same way.The modules that can perform the aforementioned tasks are being constructed for the ParkSEIS-HMA (PS-HMA) software package. Once they are available, all output results of Vs, H, and T will be displayed with respect to the survey distance, not to the record number. In addition, there will be a separate UTM display that can show the survey path in an X-Y chart.
ParkSEIS-HMA (PS-HMA) TDMS File HandlerThe way the raw data files in TDMS format (*.tdms) are handled in PS-HMA has been modified. Previously, each raw file was copied from the PXI folder to a local folder in the laptop computer sequentially in the order of creation. Each copied file then would go through subsequent time-consuming steps of data conversion and analysis to generate output results (e.g., Vs, H, T, etc.). Although the survey itself usually takes only a few minutes to drive about 1-km distance, the PXI system could not be turned off until the PS-HMA completes all steps of operation with all files in the PXI folder. Termination of the PXI system as early as possible is recommended to ptoretct the system from excessive heat and also to save battery power.Now, PS-HMA puts the highest priority on copying all raw files existing in the PXI folder so that they are copied to the local folder in the laptop computer as soon as possible. Then, the remaining analysis steps can proceed only within the laptop computer without the need to communicate with the PXI system. This enables the PXI system to be turned off as soon as the survey is finished.
Progress Table (Prime Contractor - Park Seismic LLC) - April 2021

Progress Table (Sub Contractor - Norrfee Tech) - April 2021

May
Summary
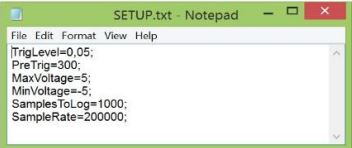
- "SETUP.TXT" and "STOP.TXT" to Control PXI System from ParkSEIS-HMA Software
The parameters directly related to the PXI system's data recording have been controlled only by the PXI control software running on the PXI's operating system. They can now be controlled by the ParkSEIS-HMA (PS-HMA) software package. The "SETUP.TXT" file written by PS-HMA contains all those parameters specified by a graphical user interface (GUI) of PS-HMA, which is under construction. The structure of the file is displayed below. This file is written on the PXI folder immediately after the "ARM" button in PS-HMA is pressed down, 0.5-s before the "ARM.TXT" is written. Then, the PXI system carries the new parameters to update the corresponding functionalities immediately.The "STOP.TXT" is written by PS-HMA on the PXI folder to signal that the PXI-confrol software can shut down the system. This is introduced to physically shut down the PXI system from PS-HMA without an access to the PXI system switch. - NRRA Presentation ("Research Pays Off")
 A project update presentation was made on May 18, 2021, during the NRRA's "Research Pays Off" webinar series. It is posted on YouTube. It presented the historical development of seismic method for pavement evaluation that ultimately led to the execution of current project at MnDOT. It also presented the progress made during the last 16 months of project execution as well as the projection for the remaining period. The presentation file (*.pptx) is available here.
Progress Table (Prime Contractor - Park Seismic LLC) - May, 2021
Progress Table (Sub Contractor - Norrfee Tech) - May, 2021

June
Summary
- ParkSEIS-HMA Updates for PXI Control
The ParkSEIS-HMA software package (PS-HMA) has been updated to properly control the PXI acquisition system. By using the separate text file of "SETUP.TXT", it can provide key recording-related parameters (e.g., trigger level, max and min voltage levels, sampling rate, etc.) to the PXI control software (being built at Norrfee Tech) at the proper time of the PS-HMA execution. It also provides "STOP.TXT", "ARM.TXT", and "DISARM.TXT" at other proper stages and times of the PS-HMA execution so that the PXI control software can shut-down the system ("STOP.TXT"), make the system ready for recording ("ARM.TXT"), and disable the recording functionality ("DISARM.TXT"), respectively. It can now detect old TDMS files that may remain at the measurement folder in PXI system (e.g., "c:\MeasurementFiles") and provide options to delete and backup. Details are explained in this readme file.This newer version was delivered to Norrfee Tech on June 25, 2021, to be used for next Joint Field Test (JFT). - PXI Control Software Update
The PXI control software being built at Norrfee Tech was updated to accommodate the changes and updates in PS-HMA outlined above.
Progress Table (Prime Contractor - Park Seismic LLC) - June 2021

Progress Table (Sub Contractor - Norrfee Tech) - June 2021
July
Summary
- Contract Amendment Submit
Due to the COVID pandemic, there has been a significant change and delay in work schedule and progress of the subcontractor (Norrfee Tech) during the last 1.5 years. In consequence, the two (1st and 2nd) Joint Field Test (JFT) scheduled to take place in Lund, Sweden, was (will be) replaced by multiple remote sequential tests of hardware and software through a prolonged period (e.g., 1-6 months). The new amended project schedule includes an extension of the project period from October 2021 to June 2022. It also includes a budget reallocation between labor and direct expenses without change in the total amount already granted. The proposed contract amendment has been submitted for approval on July 12, 2021. - Quarterly Report Submit (Q2-2021)
The second quarterly report in 2021 has been submitted to the TAP members on July 17, 2021. It is posted here. - ParkSEIS-HMA GPS Display Module
The GPS data display module in ParkSEIS-HMA (PS-HMA) software package has been under development. It is now complete up to the stage where it can display existing GPS data file in a chart of equal horizontal-vertcal scale. It can also import an image (*.jpg) of Google satellite map in the background so that the displayed GPS data points can be overlapped. The mutual scales can be adjusted by using mouse panning and scroll zoom. An example display of the GPS data collected during the 1st Joint Field Test (1st JFT) executed during February 2021 is displayed below.

Progress Table (Prime Contractor - Park Seismic LLC) - July 2021

Progress Table (Sub Contractor - Norrfee Tech) - July 2021

Aug
Summary
- Contract Amendment Submit
As of August 26, 2021, the requested contract amendment has been approved by the MnDOT Research Services Section. The new amended project schedule includes an extension of the project period from October 2021 to June 2022. It also includes a budget reallocation between labor and direct expenses without change in the total amount already granted. - ParkSEIS-HMA (PS-HMA) GPS Display Module
The GPS data display module in the ParkSEIS-HMA (PS-HMA) software package has been under development for the last few months. It continued this month so that it can capture and import a Google map through a few simple steps. The "capture' module can save the map displayed on the screen as an image file (*.jpg) along with a distance scale and the location information (latitude and longitude) of a reference point on the map. Next stage of the development will import this saved file and display on the background of the current display of GPS data points. - The 2nd Joint Field Test (JFT) Executed (August 31, 2021)The second joint field test of both hardware system developed at the Norrfee Tech (NT) and the software package developed at Park Seismic LLC (PS) has been conducted at the same location previously used for the 1st JFT performed on February 26, 2021. A short video clip recorded inside the survey vehicle is posted here. The main purpose was to collect the data while the HMA pavement is at much higher temperatures than the 1st JFT so that the severity of seismic wave attenuation can be assessed. The average temperature during the 2nd JFT was about 33 degrees in Celcius, whereas it was about 7 degress during the 1st JFT. Other sencondary purposes included the accuracy evaluation of the GPS measurement by the hardware system and the overall reliability in the assessment of velocity (Vs) and thickness (H) by the PS-HMA package under "warm" temperature condition.
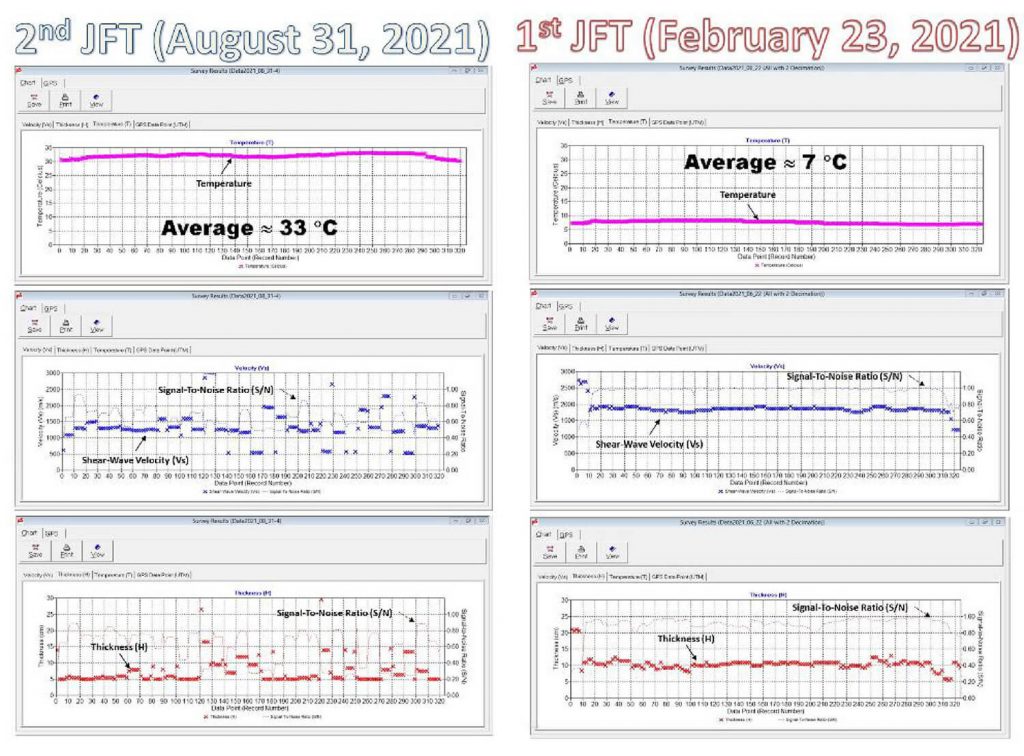
The results of velocity (Vs) and thickness (H) evaluation by the PS-HMA package are displayed below left along with the temperature data. The corresponding results obtained during the 1st JFT are also displayed (below right) for the comparison purposes. Athough more data points were obtained during the 1st JFT (about 2000 points), results are displayed only for the first 320 points, the number of data points the 2nd JFT collected.
The velocity (Vs) results indicate the overall values are about 1300 m/s that is much lower than the value obtained during the 1st JFT (about 1800 m/s), conforming to the general notion that the HMA pavement becomes "softer" when "warmer." It is noticeable, however, that the values highly fluctuate and the overall signal-to-noise ratio (S/N) values are much lower (e.g., 0.60) than the values during the 1st JFT (e.g., 0.99). It is believed this is due to the increased attenuation of seismic waves under warm temperature. In addition, those velocity values highly deviating from the average value (e.g., 500 m/s, 2000 m/s, etc.) have particularly lower S/N values (e.g., 0.40- 0.50), while those close to the average value have relatively higher S/N values (e.g., 0.70-0.90). Display of only those velocity (Vs) values above a certain cut-off S/N value (e.g., > 0.70) will remove the "outliers" in the plot.
The thickness (H) results indicate the most common values are about 5 cm (70%) and others (30%) fluctuate beetween 5 cm and 15 cm. It seems there is also a correlation in S/N values between the most common thickness value (e.g., S/N=0.80) and those fluctuating ones (e.g., S/N=0.40). The 1st JFT results shows the most commmon value is about 10 cm with much lesser degree of fluctuation. As the thickness value should not change with temperature, one of the two values (i.e., 5 cm or 10 cm) should be a more accurate one. Considering the overall S/N values for the 1st JFT results are higher (e.g., 0.95) than for the 2nd JFT results (e.g., 0.50), H=10 cm seems more accurate value. More detailed investigation is currently under way.
Norrfee Tech (NT) is currently investigating the accuracy of GPS data and examining for possible delays in measurements. NT and Park Seismic (PS) are currently investigating what caused the "TDMS conversion error" that occurred when the number of records per TDMS (NRCD) exceeded ten (10).
More thorough analysis results of the 2nd JFT data will be available in the next month's progress page (i.e., 09-2021).
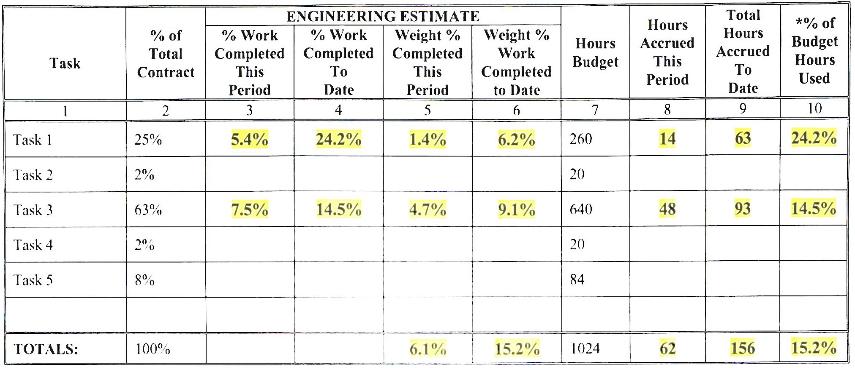
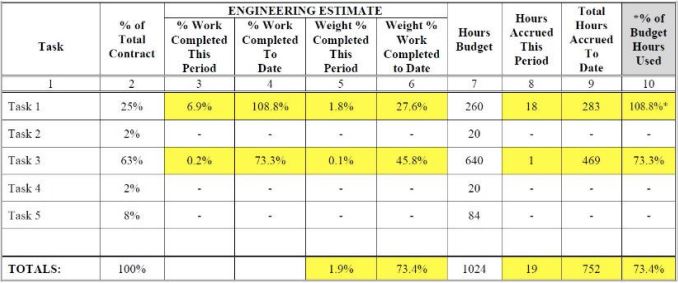
Progress Table** - August 2021
(**According to the amended contract, only the total progress form of both prime and sub contractors is reported every month)

Note: If Budgeted hours used for any task exceeds 100%, Contractor must attach an explanation to the invoice package.
*More admin hours are used that anticipated and these hours are currently substituted by unused hours in tasks #4 and #5. This type of mutual adjustment in actual task hours used will be made accordingly as the project execution continues.
Sep
Summary
- Preliminary Analysis of Data Sets from the 2nd Joint Field Test (JFT) Executed on August 31, 2021
Norrfee Tech executed the second Joint Field Test (2nd JFT) on August 31, 2021, on the same road previously used for the 1st JFT executed in February 2021. The main purpose was to compare the quality of Lamb waves collected under relatively warm temperature to the quality at lower temperature. The measured average temperature along about 100-m long road was 33 C, while it was 7 C during the 1st JFT. Other purposes included a field test of GPS measurement in the PXI system and the pseudo-real-time TDMS data conversion of the ParkSEIS-HMA (PS-HMA) software. Occasional delayed GPS measurements were observed on the first day, and the issues were resolved from further field tests on the following days by the Norrfee Tech. The software issues in the transfer of TDMS files were also identified during both lab and field tests. They were subsequently resolved through mutual communication between Norrfee Tech and Park Seismic as well as algorithmic modifications in PS-HMA.
In this report, preliminary analysis results are presented in comparison to those from the 1st JFT. They are compared in the evaluation results of seismic velocity (Vs) and thickness (H) of the avement. The 2nd JFT results are presented first, and then those from the 1st JFT are presented. They are compared in the consistency of the values (Vs and H) along the surveyed distance of pavement. Their overall signal-to-noise (SN) ratios are also compared.
The average velocities (Vs) are observed at about 1300 m/s, which is lower than those observed at lower temperatures during the 1st JFT (e.g., 1800 m/s). However, the overall SN ratios are observed about 50%, while it was above 95% for the 1st JFT. It is believed this significant difference in S/N originated from the severe attenuation of seismic waves at the high temperature. The average thicknesses (H) are observed at about 5 cm, which is significantly different than those from the 1st JFT (e.g., 10 cm). Considering the lower overall S/N, the values from the 1st JFT are believed more reliable.
Results of the attenuation analyses for both 1st and 2nd JFT data sets are also presented in the report.
- ParkSEIS-HMA GPS Display Module
The GPS data display module in the ParkSEIS-HMA (PS-HMA) software package has been under development for the last few months. It continued this month so that it can capture and import a Google map through a few simple steps. The "capture" module (see a screenshot displayed below) can save the map displayed on the screen as an image file (*.jpg) along with a distance scale and the location information (latitude and longitude) of a reference point on the map. Then, the GPS data display module (see a screenshot displayed below) can import the saved file and display the map on the background of the current display of GPS data points. The GPS data display module has options to pan and zoom both background image and displayed GPS data.
PS-HMA "Capture Map" Module

PS-HMA "GPS Display" Module

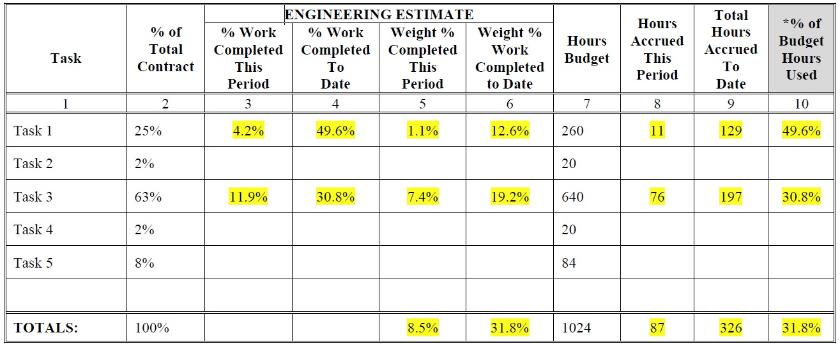
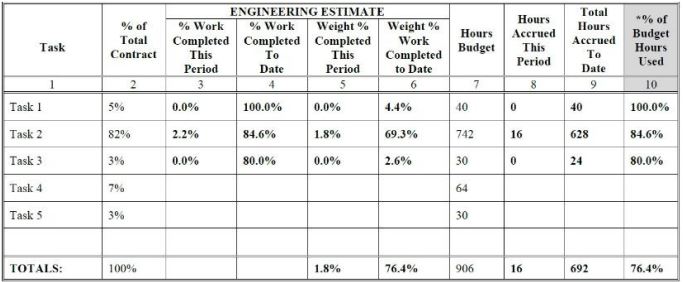
Progress Table** - September 2021
(**According to the amended contract, only the total progress form of both prime and sub contractors is reported every month)

Oct
Summary
- New Park Seismic LLC Web Site Open After 8-month Rennovation
The Park Seismic LLC web site has been under upgrade rennovation since March 2021. It was an unavoidable change because of the discontinuation of the old web-build platform that used to be supported by the web-hosting company (Yahoo) at the end of February 2021. All project contents had been internally updated and saved every month since March. They have been now posted on the corresponding project web pages as of October 2021.
- Project Management and Administration
Based on the amended project contract approved in August 2021, the travel-related funds had been reallocated for more labor hours. In consequence, the new invoice (Exhibit D-1) and progress report (Exhibit E-1) forms are now used for the monthly invoicing package whenever submitted. In addition, as all admin hours (task #1) have been consumed (and the amended contract failed to account for this when prepared), admin hours are now being reported under different tasks (e.g., #4 and #5).
The third quarterly report of 2021 was submitted on October 29, 2021. It is posted at the bottom of this web page.
- 2D System Being Built at Norrfee Tech
Norrfee Tech started wiring for the 2D system that consist of a 64-channel AD converter and four (4) of 16-channel microphone arrays. It also started designing the frame to be harnessed on a bycycle rack that will hold the four receiver arrays and one common impact source. The frame will allow each 16-channel array to be adjusted in its location along a dedicated rod, four of which will be radially arranged on the frame with the impact point located at the origin. The current design of the frame aims at a maximum 5-ft lateral (transverse) range that all four array can survey simultaneously.
- ParkSEIS-HMA | GPS Display Module and Velocity (Vs) - Thickness (H) Evaluation Module
The GPS display module has been under modification to improve the accuracy in the match between the measured GPS data points and imported Google map image displayed on the background. Another mode to import a map image has been added to improve the resolution of the display and also the accuracy in the match. It can now import a high-resolution (e.g., 4800 x 2645) satelite map created by using Google Earth Pro.
Velocity (Vs) and thickness (H) evaluation module has been modified to improve the overall accuracy and consistency. Previously, the signal-enhancement method that utilizes the lateral (along the longitudinal direction) stacking of constructed dispersion images could be applied only within the records contained in one TDMS file (e.g., 10 records). In consequence, the signal enhancement significantly
degraded for those records collected at the beginning and ending portions, respectively, of one TDMS file due to the limited number of previous and next records, respectively, available for the stacking. This used to cause apparent discontinuities in the display of evaluated Vs and H values at the points where a new TDMS file begins.
This has been modified. A global dispersion image is now continuously constructed as multiple TDMS files are processed. The signal-enhancement process is then applied to this global image so that the number of stacking can remain unchanged for all records. This eliminates the apparent discontinuities.
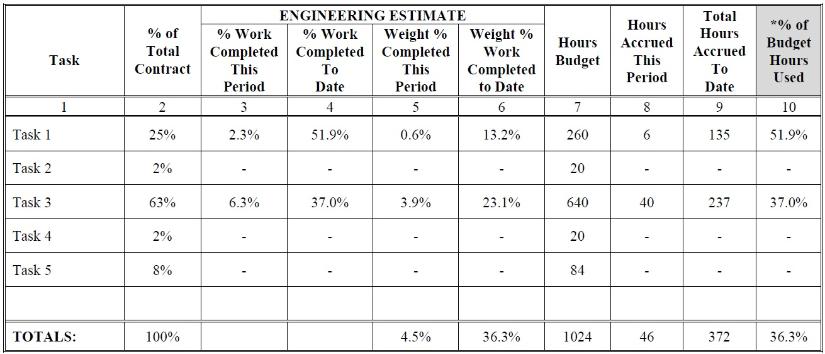
Progress Table** - October 2021
(**According to the amended contract, only the total progress form of both prime and sub contractors is reported every month)

Nov
Summary
- 2D System Under Construction at Norrfee Tech Construction of 2D arrays consisting of four (4) 16-channel arrays is under execution at Norrfee Tech. Construction of the arrayholding frame to be harnessed on the bycycle rack is also under execution.
- ParkSEIS-HMA | 2D Data Process Module and Visualization Module The process module has been constructed that imports 2D data in 64-channel TDMS files. The module seperates a TDMS data file into four subsets of 16-channel data, each of which is processed separately to generate its own results of velocity (Vs) and thickness (H) information.The visualization module is under construction and has been built up to the point where 1D results from the four arrays are independently displayed on the same chart as illustrated below. The module will include a separate visualization window to display 2D planview maps for Vs and H results that will be constructed in a pseudo-real time as data are continuously acquired
- Velocity (Vs) and Thickness (H) Evaluation of 1st and 2nd JFT Data Sets The field data sets collected during the 1st (February 23, 2021) and 2nd (August 31, 2021) Joint Field Test (JFT) are revisited to evaluate the average shear-wave velocity (Vs) and thickness (H) of the pavement. The average temperature of the pavement was 7 degrees and 33 degrees in Celsius during the 1st and 2nd JFT’s, respectively. The main purpose of the revisit is to come up with the most reliable estimations for Vs and H for the same road surveyed at significantly different temperatures. More details are prresented in this report.
ParkSEIS-HMA Visualization Module for 2D (64-Channel) Data*
*Model data sets are used for display purposes because real data sets are not available yet


Progress Table** - November 2021
(**According to the amended contract, only the total progress form of both prime and sub contractors is reported every month)
Dec
Summary
- 2D System Completed and Joint Field Test (JFT-2D) PerformedOn January 10, 2022, Norrfee Tech performed the Joint Field Test (JFT-2D) by using the completed 2D data acquisition system. More details about the system and field operation are presented in another presentation file (“Analysis220110b.pdf”) and video files prepared by Norrfee Tech. Some selected video files will be posted on YouTube in the near future. Survey photos and a sample data are presented in Figure 1 below.The JFT-2D proceeded over approximately 1800-m long asphalt road that included the segment previously used for JFT’s with 1D system. The test collected a total of 185 TDMS files, each of which contained 20 measurement records (except for the last file that contained only 3 records). A total of 3683 measurements were made, which gives an approximate rate of 2 measurements per meter or one measurement every half meter. One measurement record contains a 64-channel 5-ms recording data from four (4) MEMS microphone arrays (i.e., channels 1-16 for array#1, 17-32 for array#2, 33-48 for array#3, and 49-64 for array#4) arranged transversely with a 0.2-m separation.
The system is currently under preparation for shipping to Park Seismic where it will be used for further in-house tests to improve the performance of the entire system (i.e., hardware and software).
- ParkSEIS-HMA | Test with JFT-2D DataDuring the JFT-2D operation, Norrfee Tech also tested some key features of the ParkSEIS-HMA (PS-HMA) software package that are related to the 2D data handling (e.g., ARM, DISARM, STOP, real-time TDMS copy and conversion, real-time process and visualization of 2D results, etc.). The on-site analysis of all acquired (185) TDMS files could not be finished because of the excessive process time (e.g., hours). Instead, all files were processed afterward in the Park Seismic office by simulating the field measurement (i.e., manually feeding TDMS files to PS-HMA software). It took about four (4) hours to finish the entire data-process and visualization of the results that proceeded in a full-automatic mode. In this report file, all results obtained and visualized by the PS-HMA software are presented. The selected 2D results are displayed in Figure 2 below.All these data files are currently being used to improve the overall performance (i.e., accuracy and speed) of the analysis and visualization modules of the PS-HMA software.
- ParkSEIS-HMA | Velocity (Vs) and Thickness (H) Evaluation - Accuracy AssessmentThe velocity (Vs) and thickness (H) evaluation algorithm incorporated in the ParkSEIS-HMA package is systematically tested on modeling data sets. The algorithm was briefly explained in one of the previous reports posted online. The main purpose of the test is to assess the accuracy of the algorithm. Using the reflectivity method, seismic records are modeled based on a specific layer model that consists of velocity (Vs) and thickness (H) of typical pavement structure (i.e., pavement layer, base, and subgrade). Vs and H of the top pavement layer are controlled to generate testing seismic records.Each modeled seismic record is processed by ParkSEIS-HMA package to evaluate Vs and H that are then compared to the “true” values. First, 11 records are modeled for a given thickness (H=10 cm) at 11 arbitrarily different velocities (1000 m/s ≤ Vs ≤ 2000 m/s). Second, 10 records are modeled for a given velocity (Vs=1000 m/s) at 10 arbitrarily different thicknesses (6 cm ≤ H ≤ 15 cm). Third, 10 records are modeled for a given velocity (Vs=1500 m/s) at 10 different thicknesses (6 cm ≤ H ≤ 15 cm). Fourth, 10 records are modeled for a given velocity (Vs=2000 m/s) at 10 different thicknesses (6 cm ≤ H ≤ 15 cm). In this way, a total of 41 records are modeled. All these records are then transformed to dispersion images, to each of which the ParkSEIS-HMA package was applied to evaluate corresponding velocity (Vs) and thickness (H). All evaluated values of Vs and H are tabulated along with true values used for the modeling. Relative errors (%) are calculated to assess the accuracy of the algorithm. One example of the calculated errors is displayed in Figure 3 below. The average errors for velocity (Vs) and thickness (H) evaluations are calculated as 3.89% and 11.48%, respectively.
All these procedures are graphically illustrated in this report.
Figure 1. The Joint Field Test with completed 2D acquisition system (JFT-2D) and one sample 64-channel record obtained during the test.

Figure 2. ParkSEIS-HMA visualization of the 2D results from the JFT-2D survey.
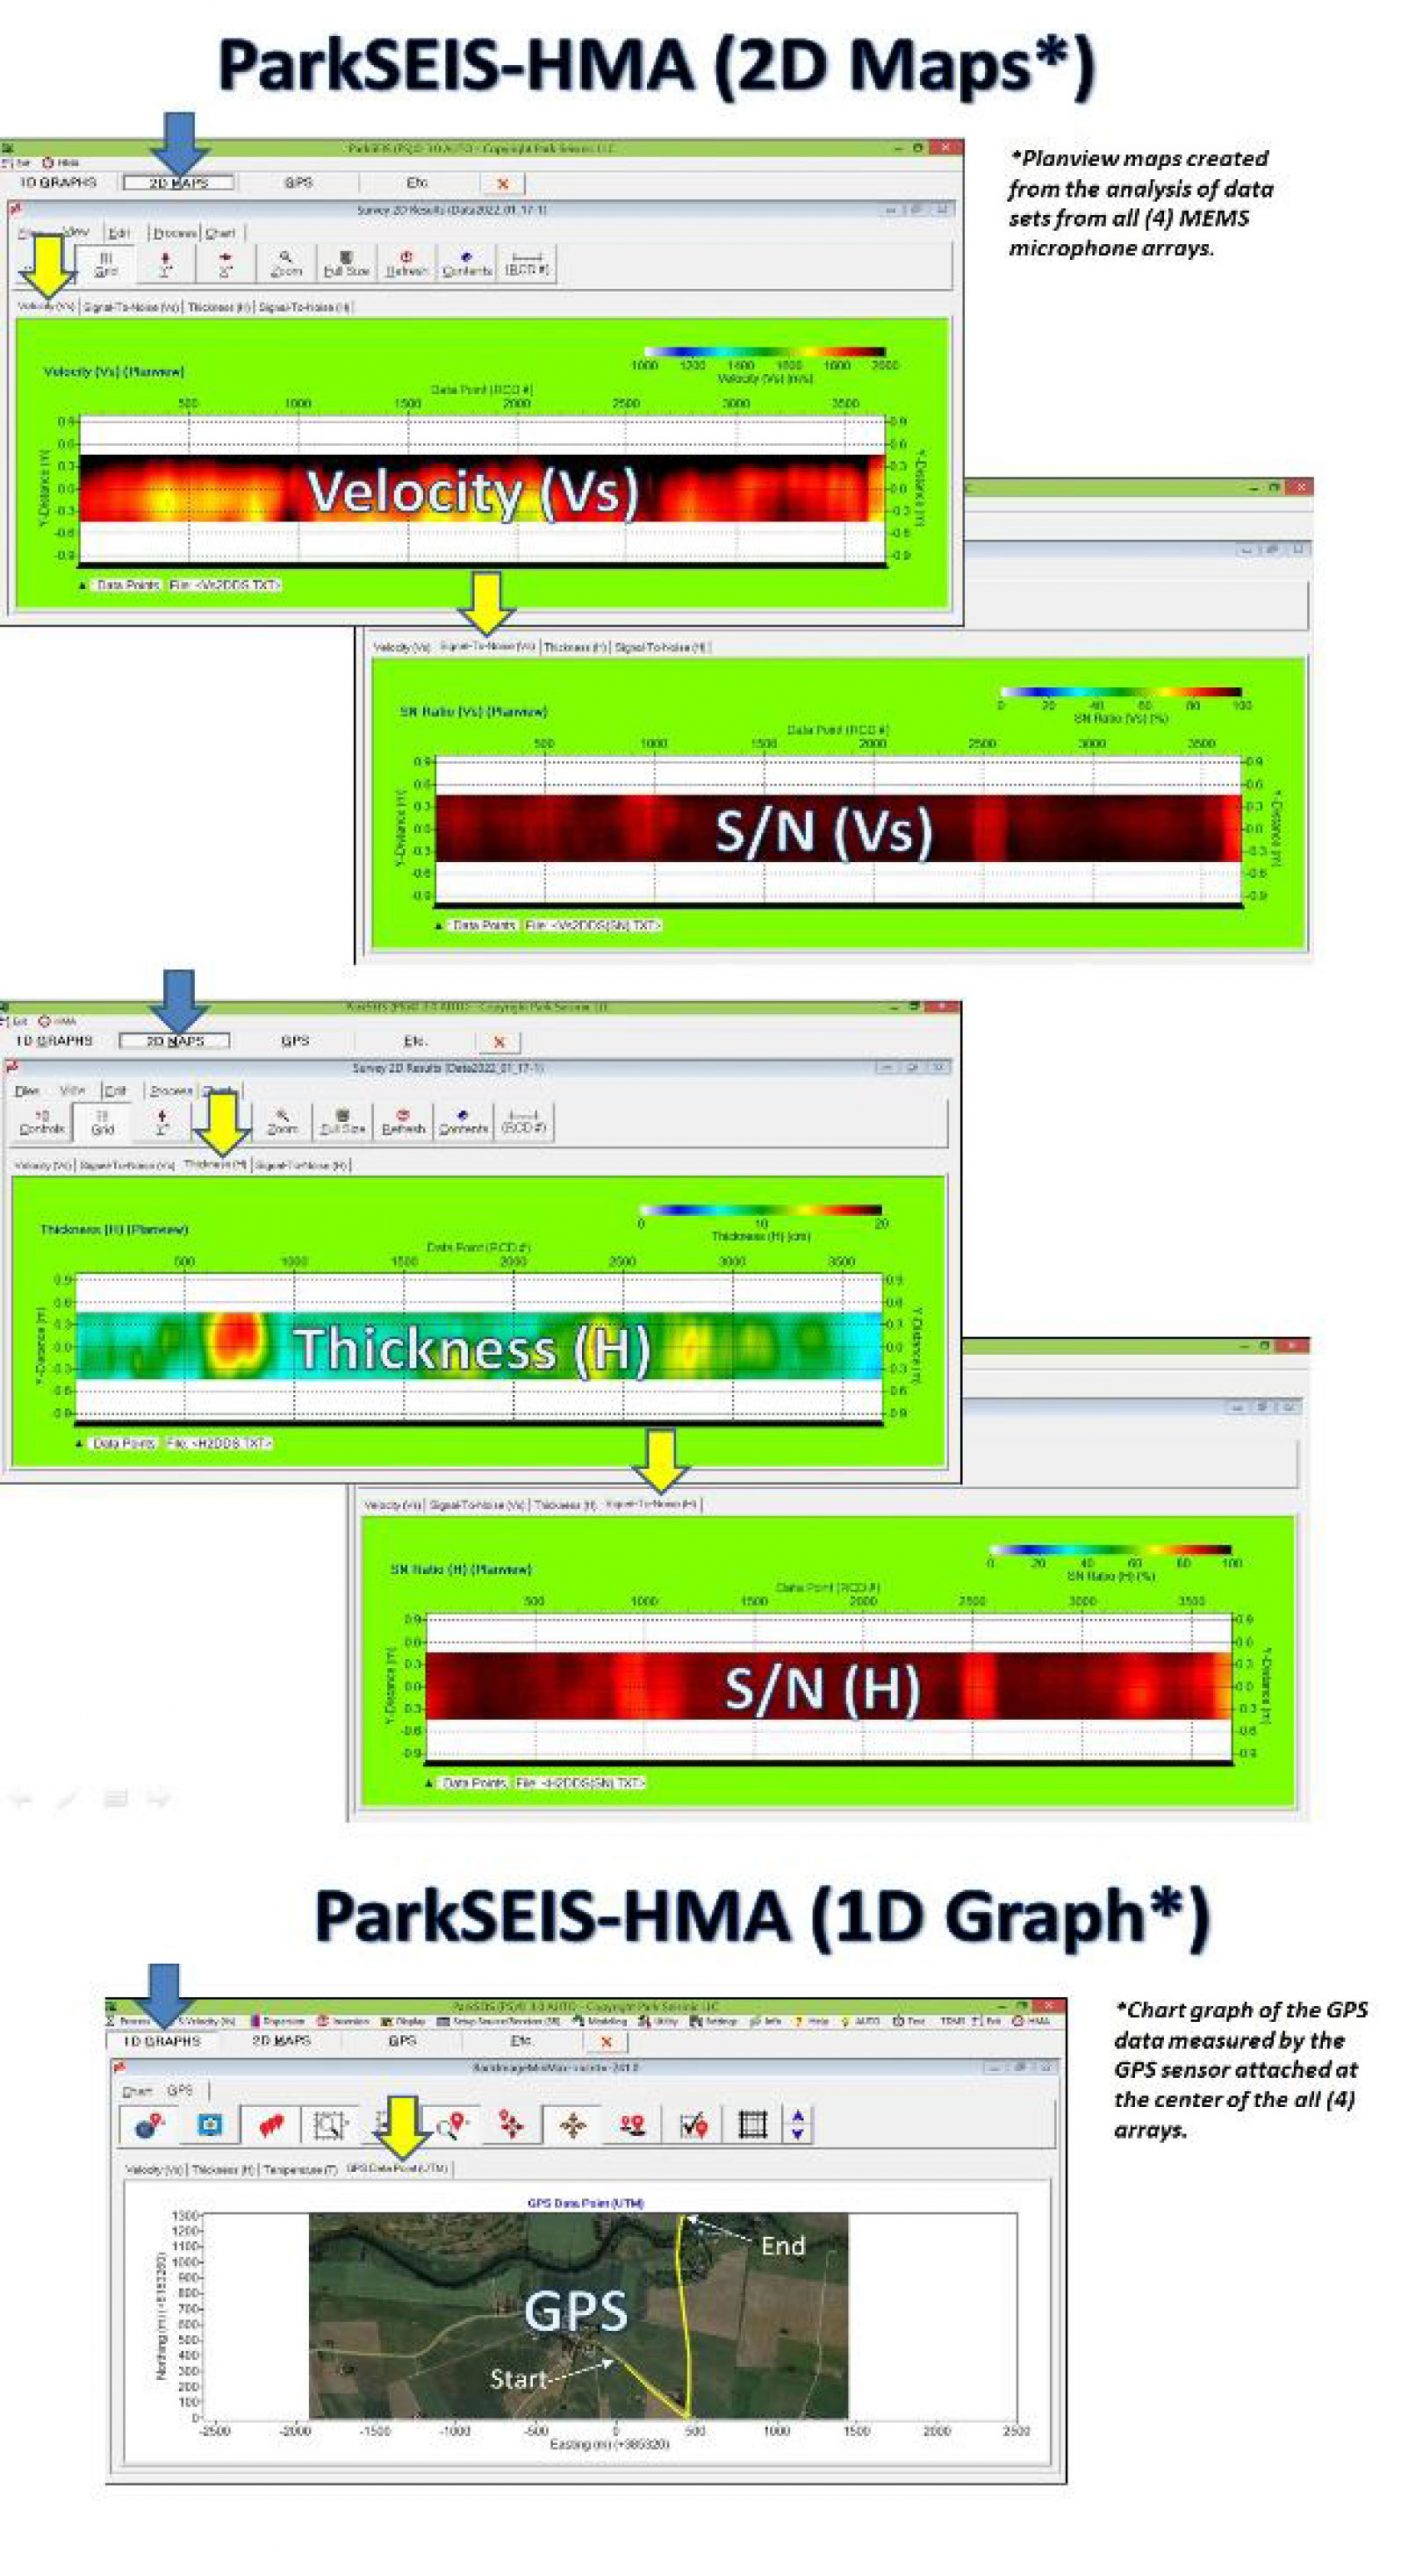
Figure 3. An example of the assessment of the accuracy in
evaluating velocity (Vs) and thickness (H) by ParkSEIS-HMA.

Progress Table** - December 2021
(**According to the amended contract, only the total progress form of both prime and sub contractors is reported every month)

QUARTERLY REPORTING
- 1st Quarterly Report (and Appendix) Submitted (April 22, 2020) | Q1-2020
- 2nd Quarterly Report Submitted (July 27, 2020) | Q2-2020
- 3rd Quarterly Report Submitted (October 20, 2020) | Q3-2020
- 4th Quarterly Report Submitted (January 19, 2021) | Q4-2020
- 1st Quarterly Report (April 20, 2021) | Q1-2021
- 2nd Quarterly Report (July 19, 2021) | Q2-2021
- 3rd Quarterly Report Q3-2021